Insight enables you to analyze for free your website speed and performances, and to compare it with and without Fasterize optimizations.
You can add as many URLs as you want such as homepage, product page, category page…
Insight runs on the principle of Synthetic Monitoring.
It simulates user conditions : location, connectivity, browser and device.
Please note that tests are run with Fasterize's default configuration. By changing this default configuration, you may improve the results.
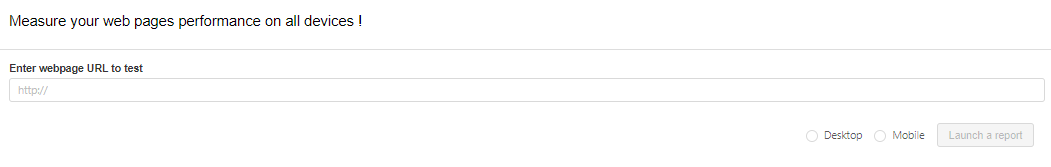
Request settings
- Fill in the URL of the page you want to test
- Choose the device : desktop or mobile.
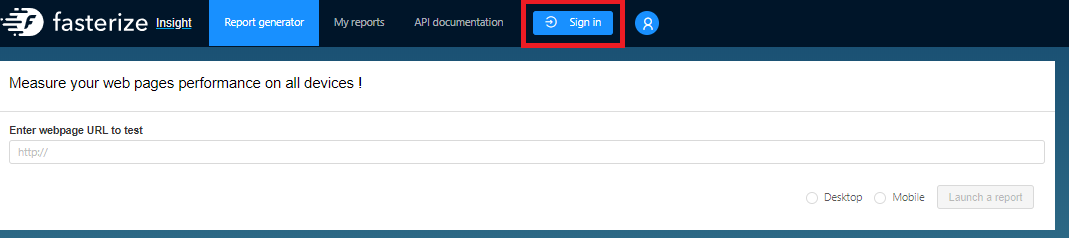
Advanced settings
You will need to log in to access advanced settings. Once logged in, you will see a "Show settings" button appear below the URL field.
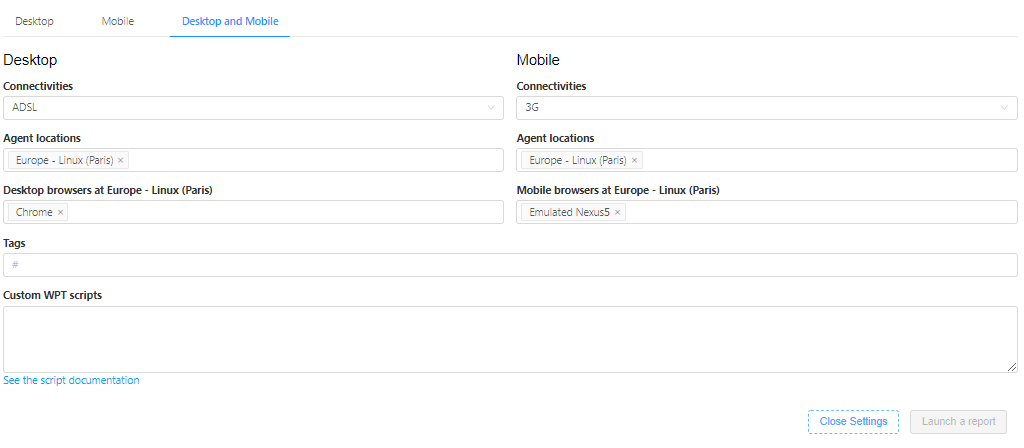
You can define the parameters to specify the conditions of your test here, in different tabs for Mobile and Desktop.
The field “Custom WPT scripts” is provided for custom scripts to specify the DNS resolution for instance or the response time of the server … or any parameter you need to specify.
Insight metrics
Key figures
Please note that you don’t necessarily need to have all of the metrics in green, but only your priority metrics. Know for example that Speed Index and Start Render are more important for your users than the Visually Complete, because users start interacting with the page before the elements are fully displayed.
- Speed Index: time it takes for the user-visible content to appear.
- Start Render: time it takes for the first contents to appear on the blank page.
- Time to first Byte: time it takes for the network and the server to generate and start sending HTML. This data corresponds to server operations, however if the TTFB is high it will have an impact on the Start Render and the Speed Index.
- RUM First Contentful Paint: time it takes for the first image or text elements to appear, aside from the background image.
- RUM First Meaningful Paint: time required for the first contents of interest to the user to appear (the picture or the description of a product for example).
- Visually Complete: time it takes for the last item to load onto the user-visible page.
- Page Size: total weight of all elements of the page.
- Request Number: total number of requests generated by the page.
- Load Time: loading time of the page, from the opening to the finalisation of the display of all elements by the browser (NB: the relevance of this indicator depends on the way the page is built).
Filmstrip
The Filmstrip section shows step by step how the page appears to the user and the time it takes for the page to load, with and without Fasterize. You can vary the interval and download the animation to share or embed it.
Video
The video shows a real-time rendering of the tested page with and without Fasterize. You can also download the video and share it.
Your reports
When logged in, you will also access a personal space “My reports” where you may save all the reports of the tests you have launched.
Action icons are available on the right side of each line in order to:

- View a report
- Copy the report URL and share
- Restart the test if you made alterations to a page
- Delete the test.
You can also use the “Bulk action button” at the top of the list to copy multiple URLs at once, or search for tested URLs by filtering their content.
If you need any help to set up your request or to read the results, please contact the Support team.
Was this article helpful?
That’s Great!
Thank you for your feedback
Sorry! We couldn't be helpful
Thank you for your feedback
Feedback sent
We appreciate your effort and will try to fix the article